MALP in two minutes
Launch your app in MPMD with the analyzer:
mpirun -np 64 malp APP [APP_ARGS] : -np 16 malp_anObserve how the application is ‘wrapped’ with the malp command and how we concurrently launch the analysis server malp_an. You can change the analysis ratio, launching less analysis process than instrumented processes. MALP also come with a wrapper for this syntax, the malpl command.
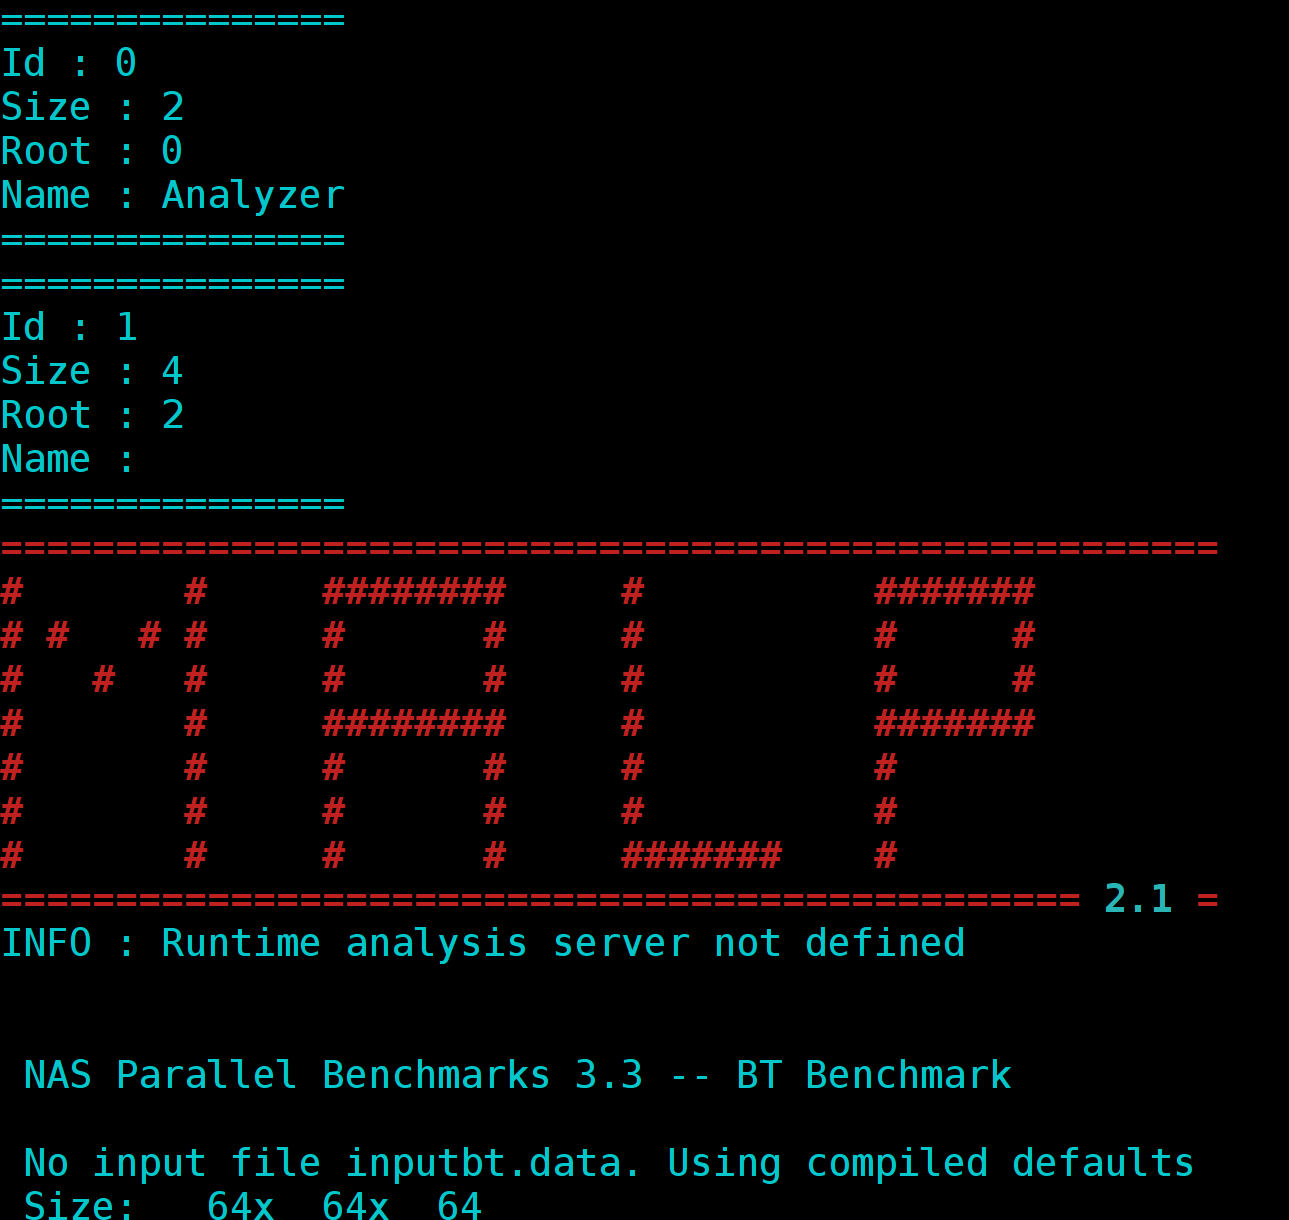
If the instrumentation succeeded you should see this header, the list before the header will give you the detected partitions (MALP can instrument several applications at once, to do so reproduce the MPMD pattern with a single analysis partition).
When the program ends, it will generate an output JSON file called, MALP_trace.json, this file contain the result of the performance analysis.
Launch the analysis server:
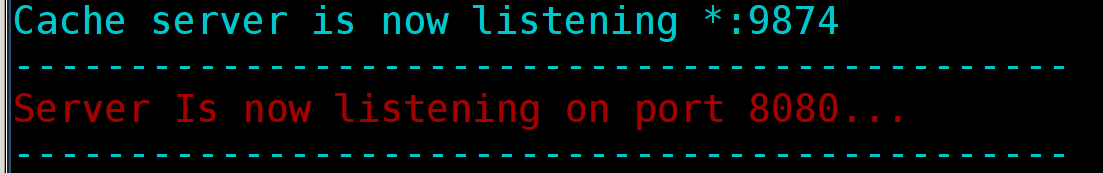
MALP_PORT=8080 malp_server
This command will launch the Node.JS server which is a place where you can manage and upload you performance traces. Note that you can launch this interface to consult previously generated profiles.
Open your default browser to this page:
x-www-browser http://127.0.0.1:8080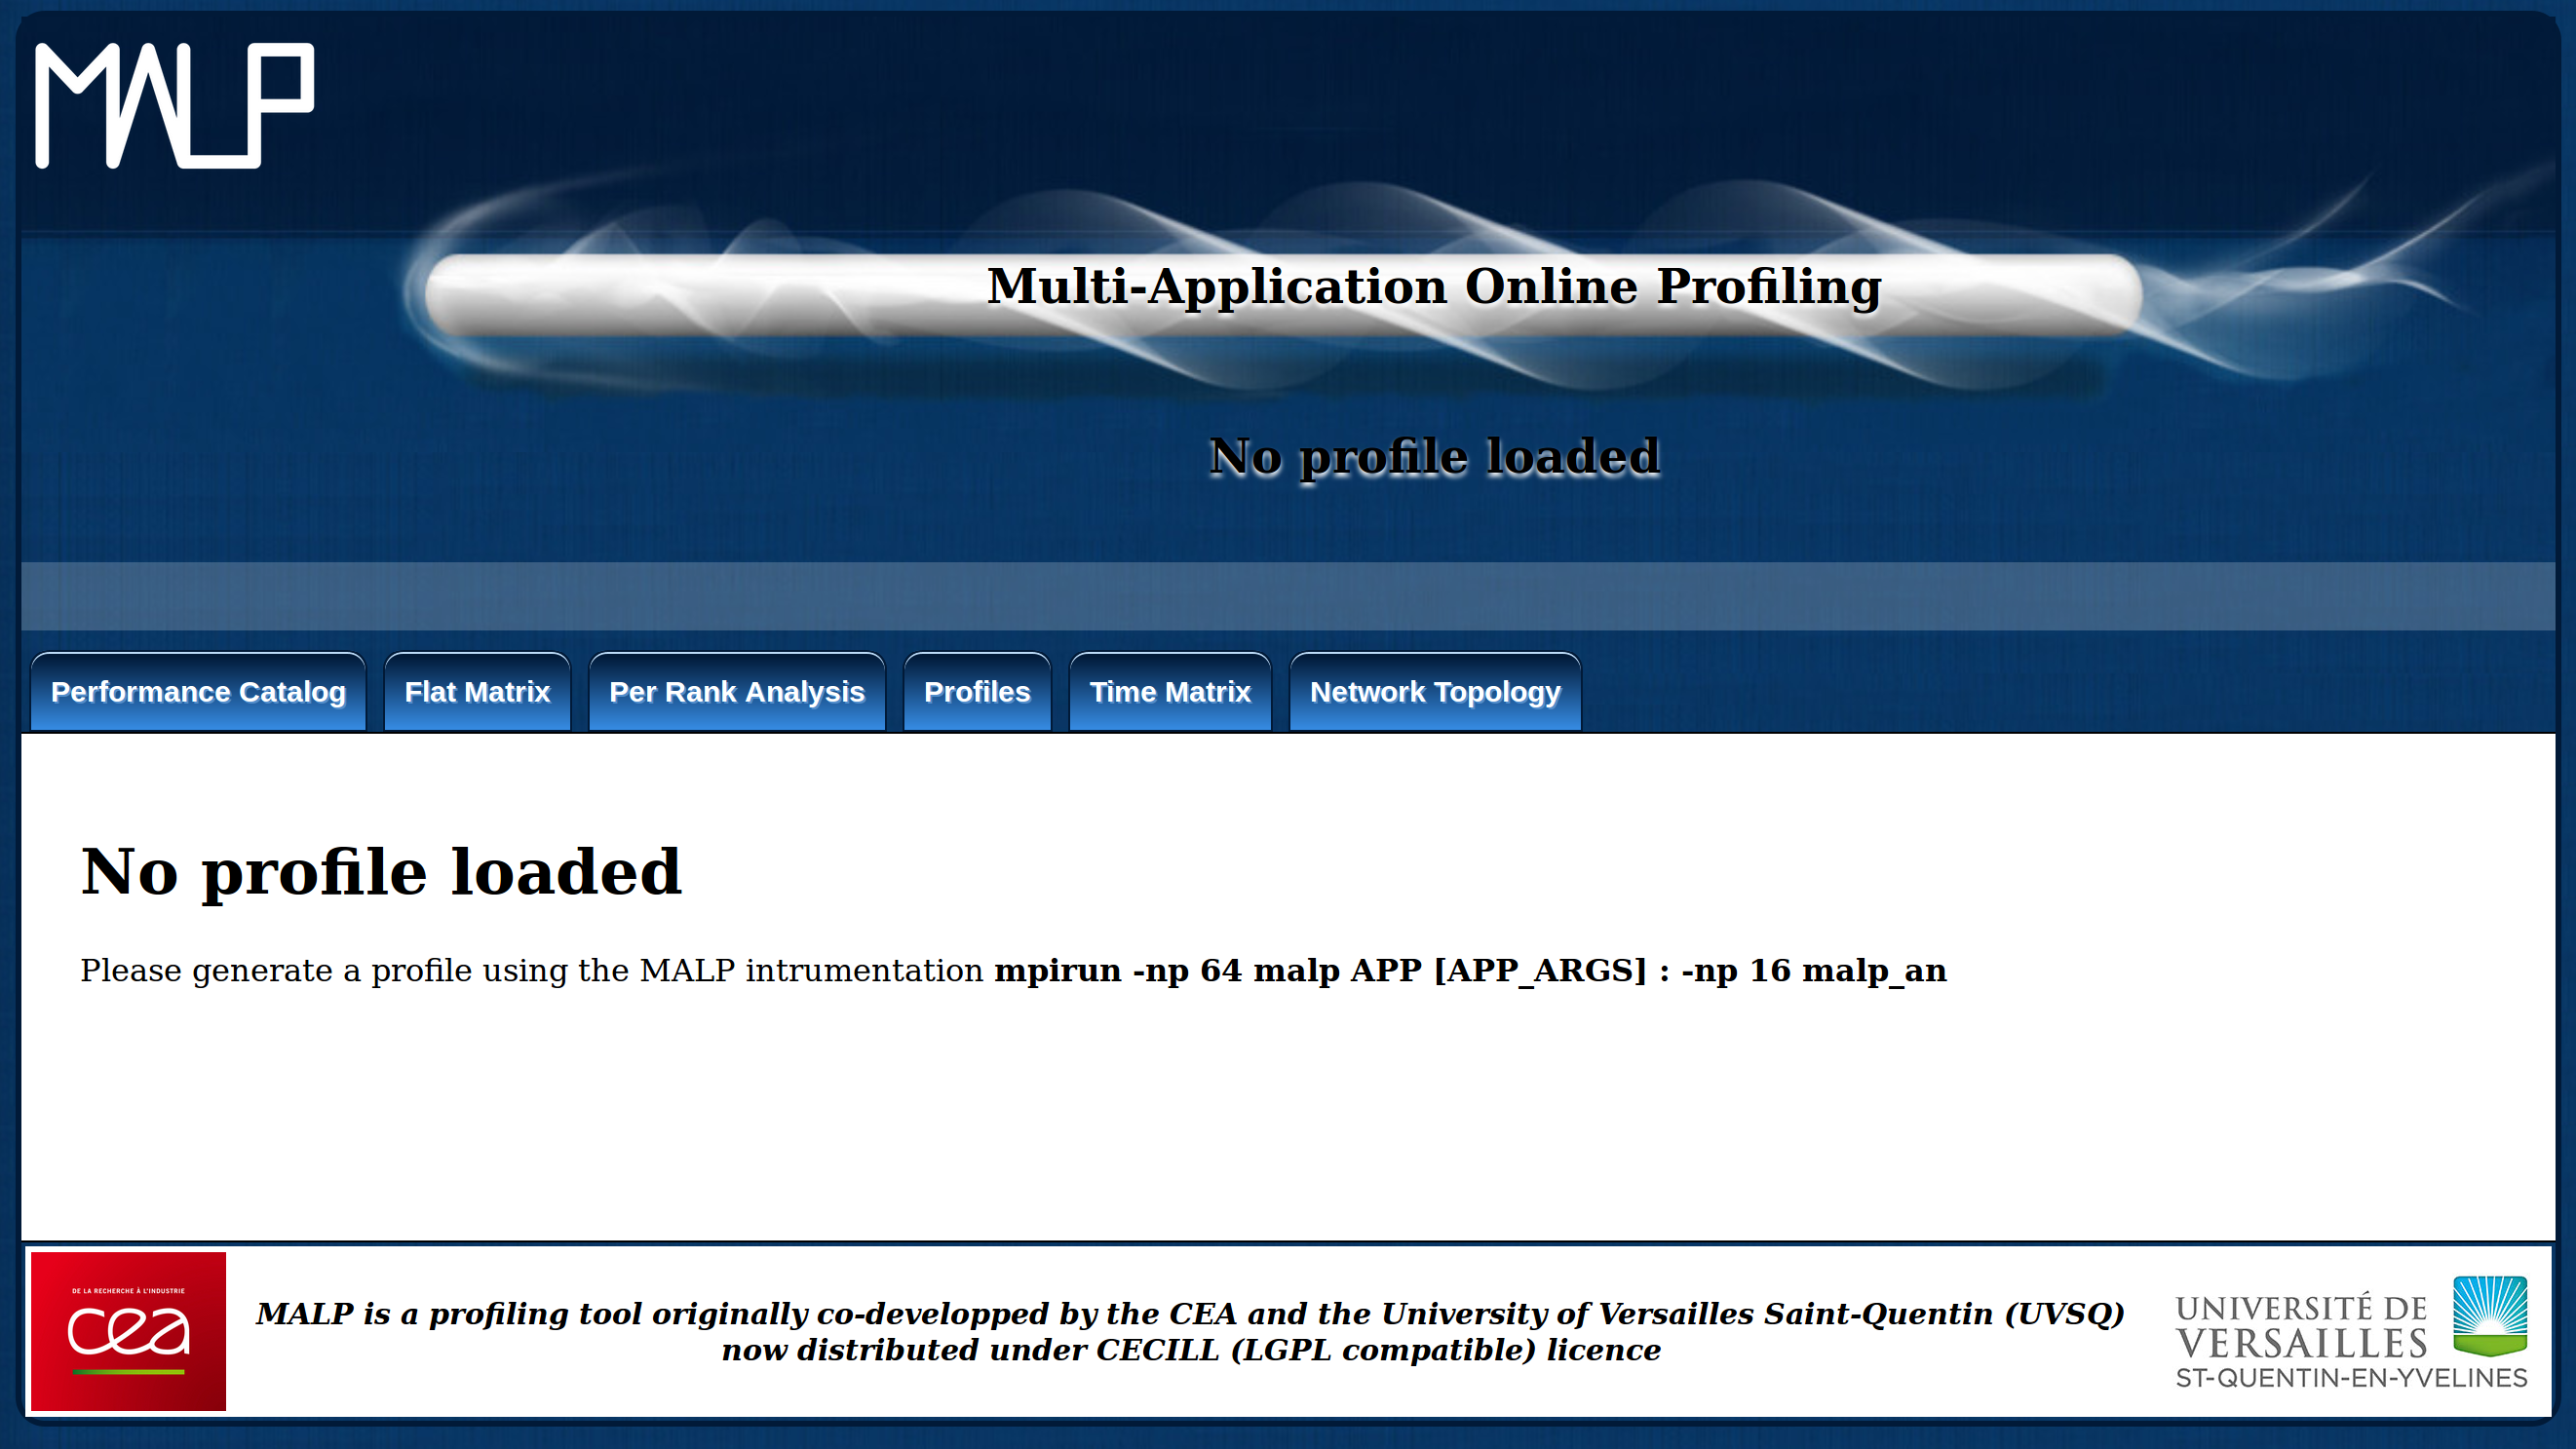
Go to the performance catalog and upload the MALP_trace.json file generated during step 1:
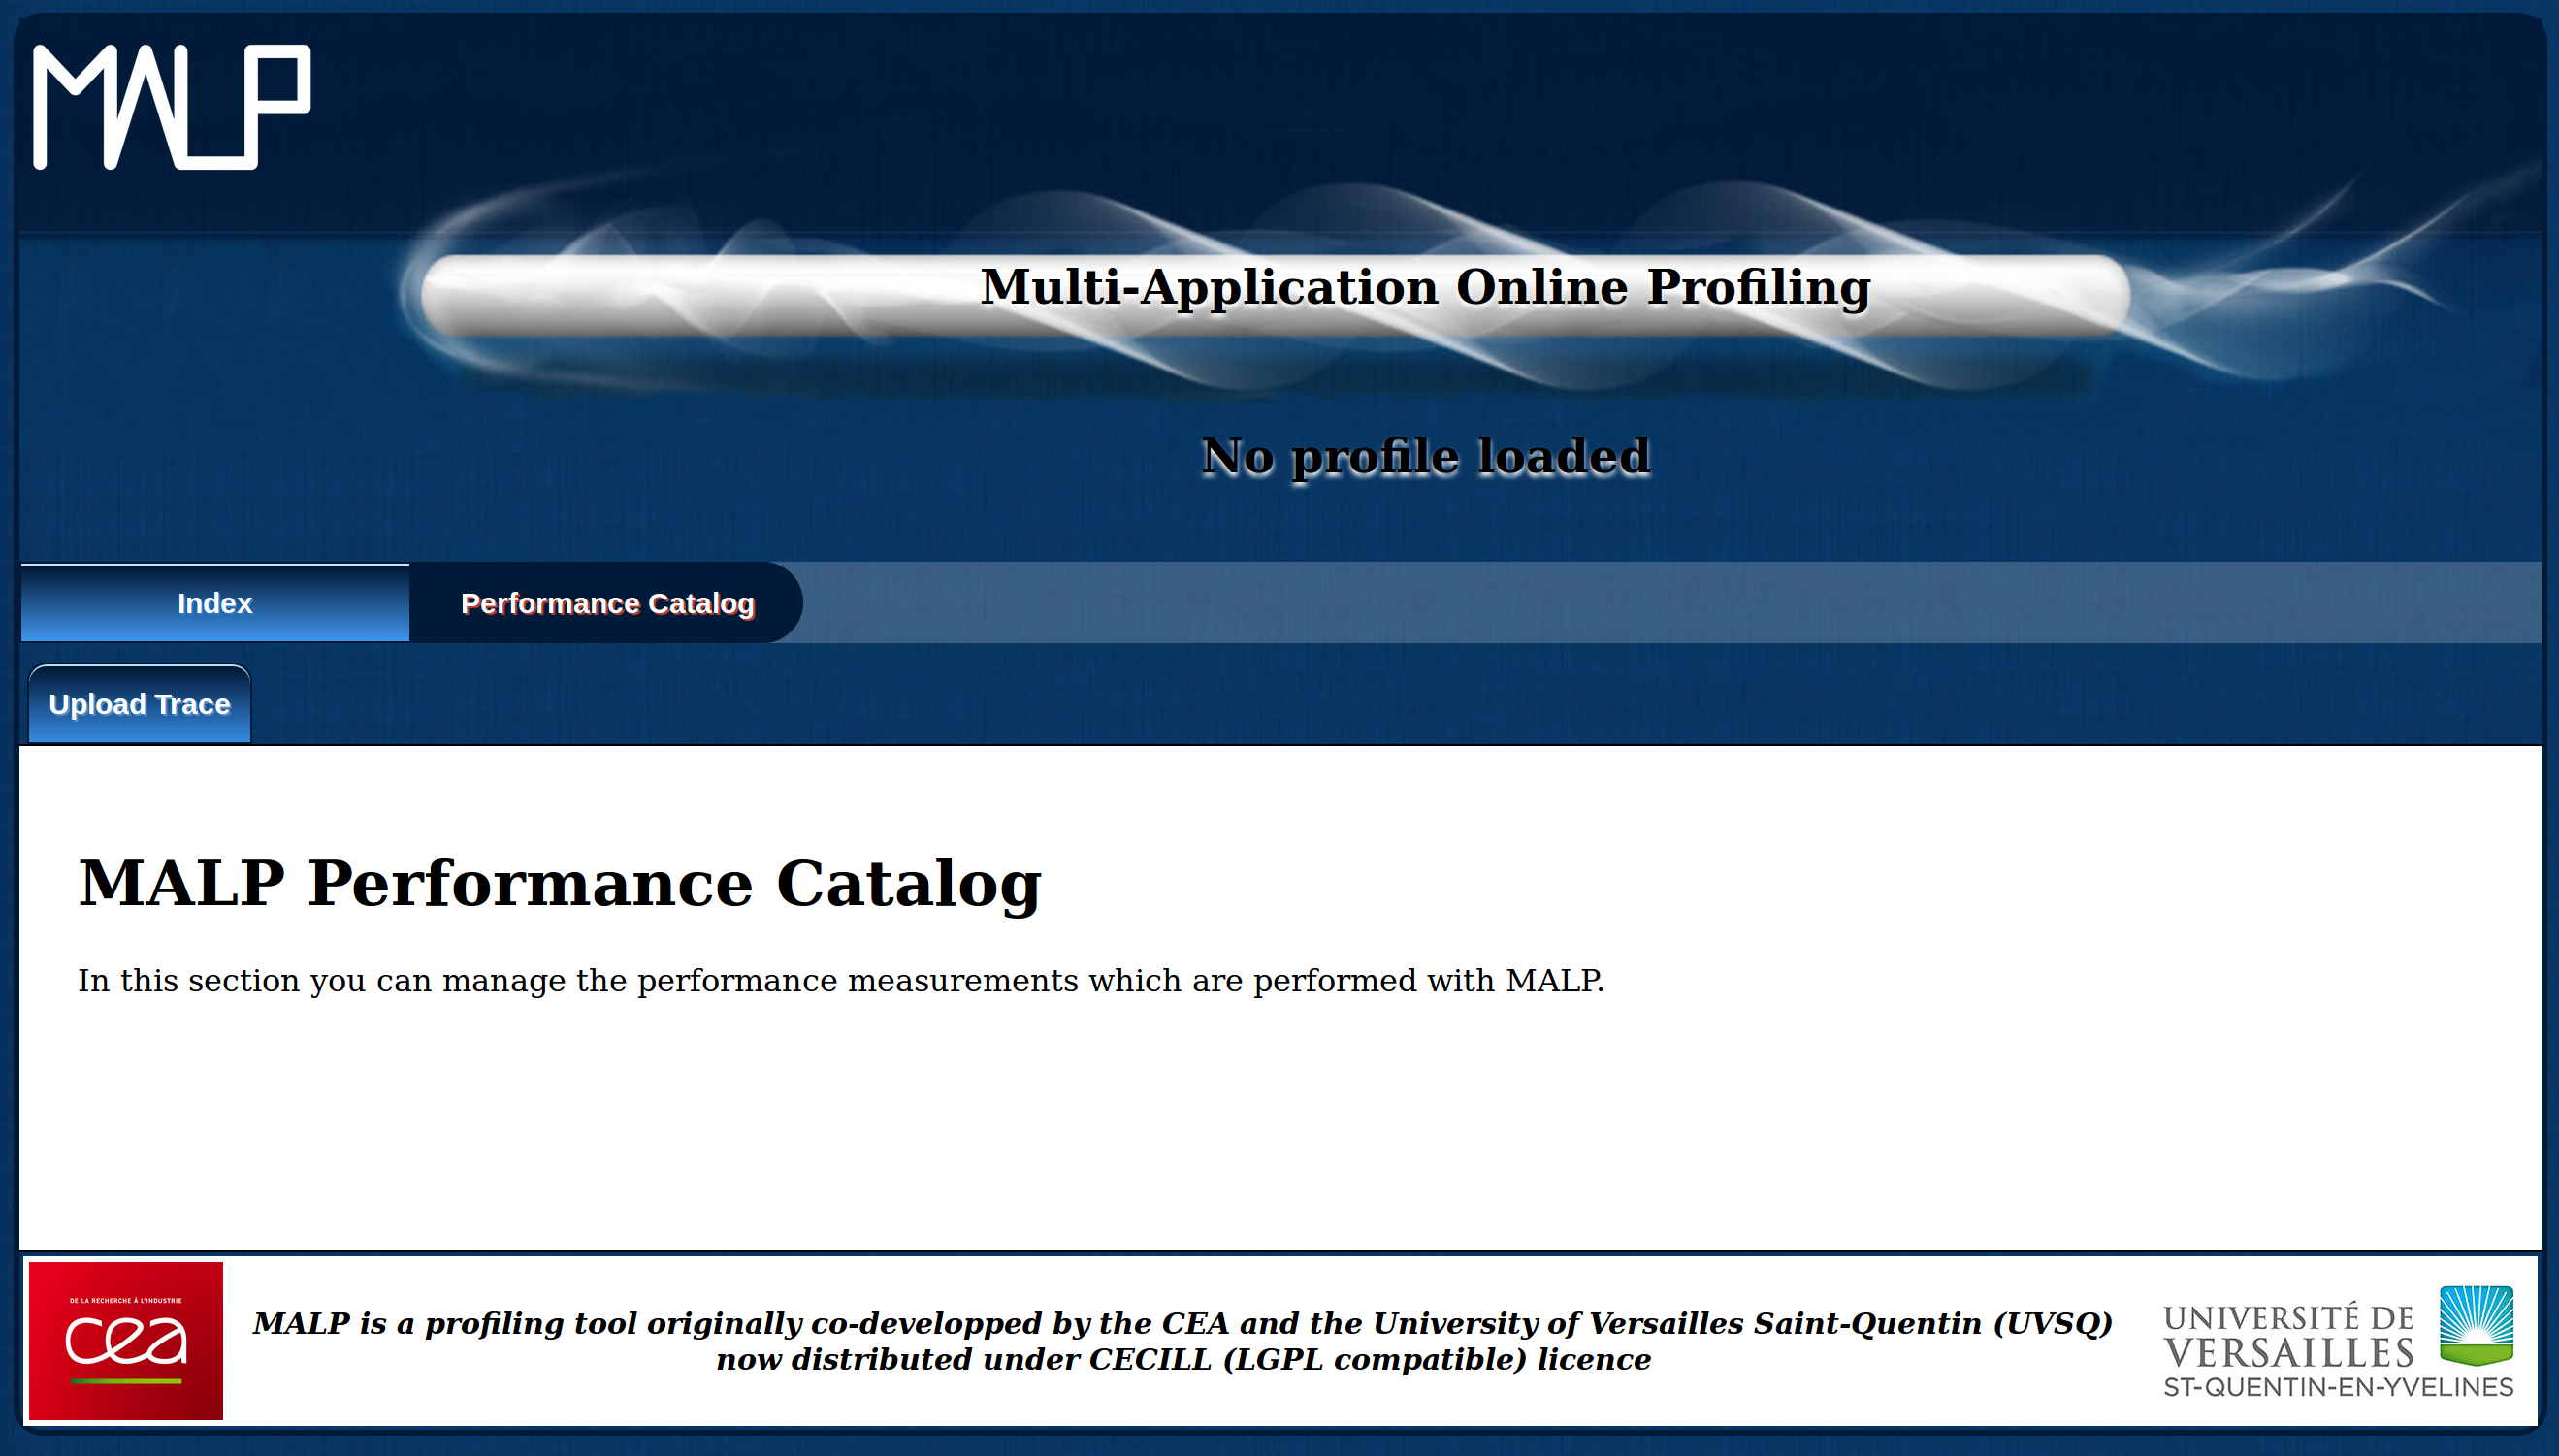

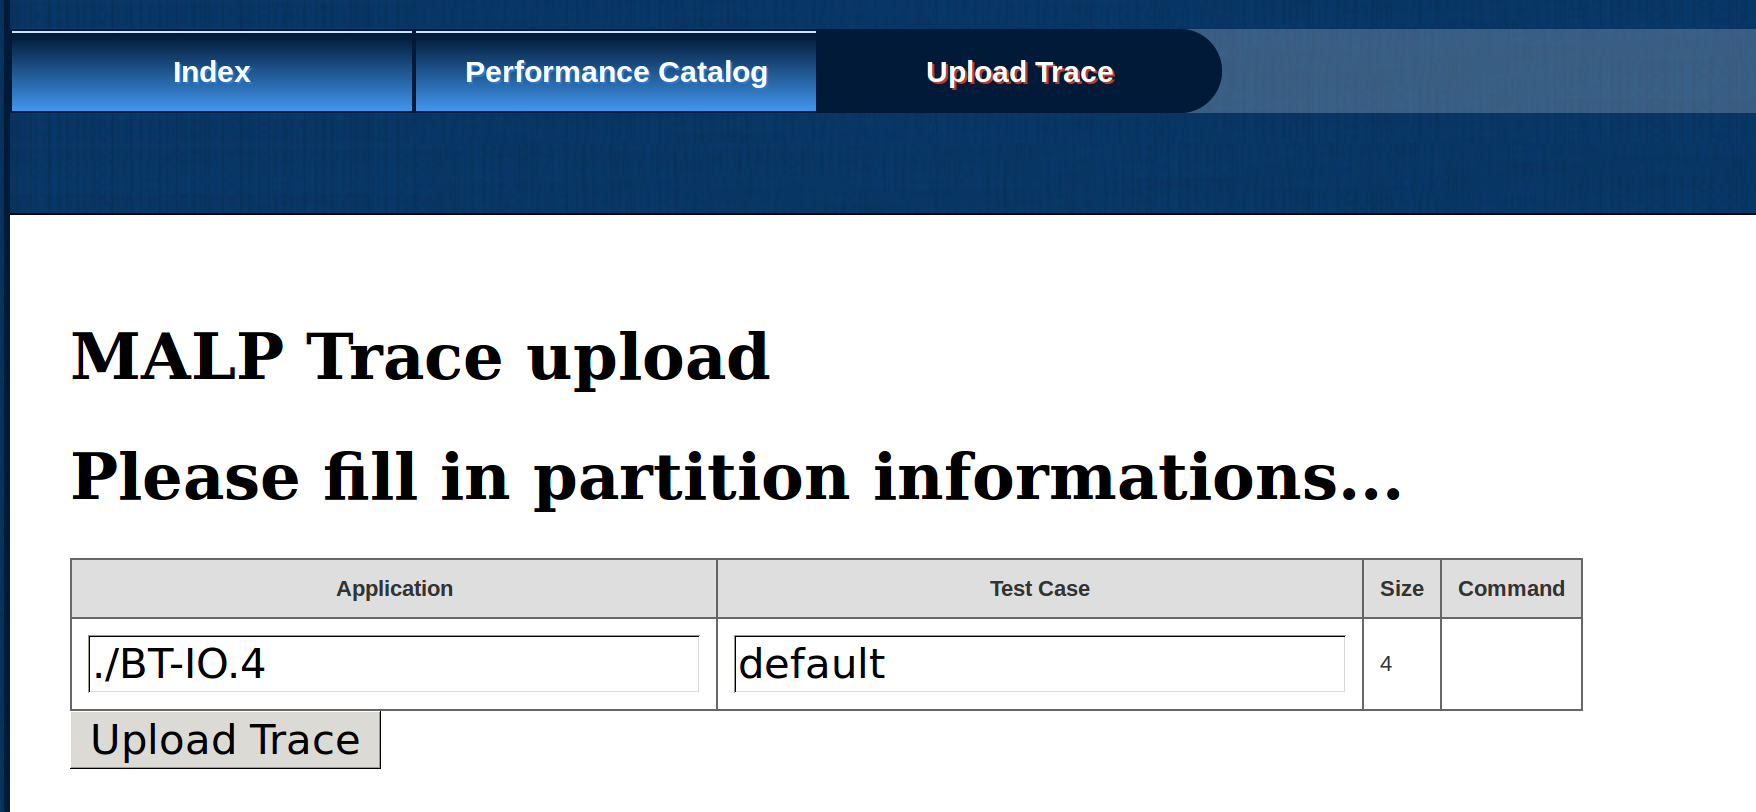
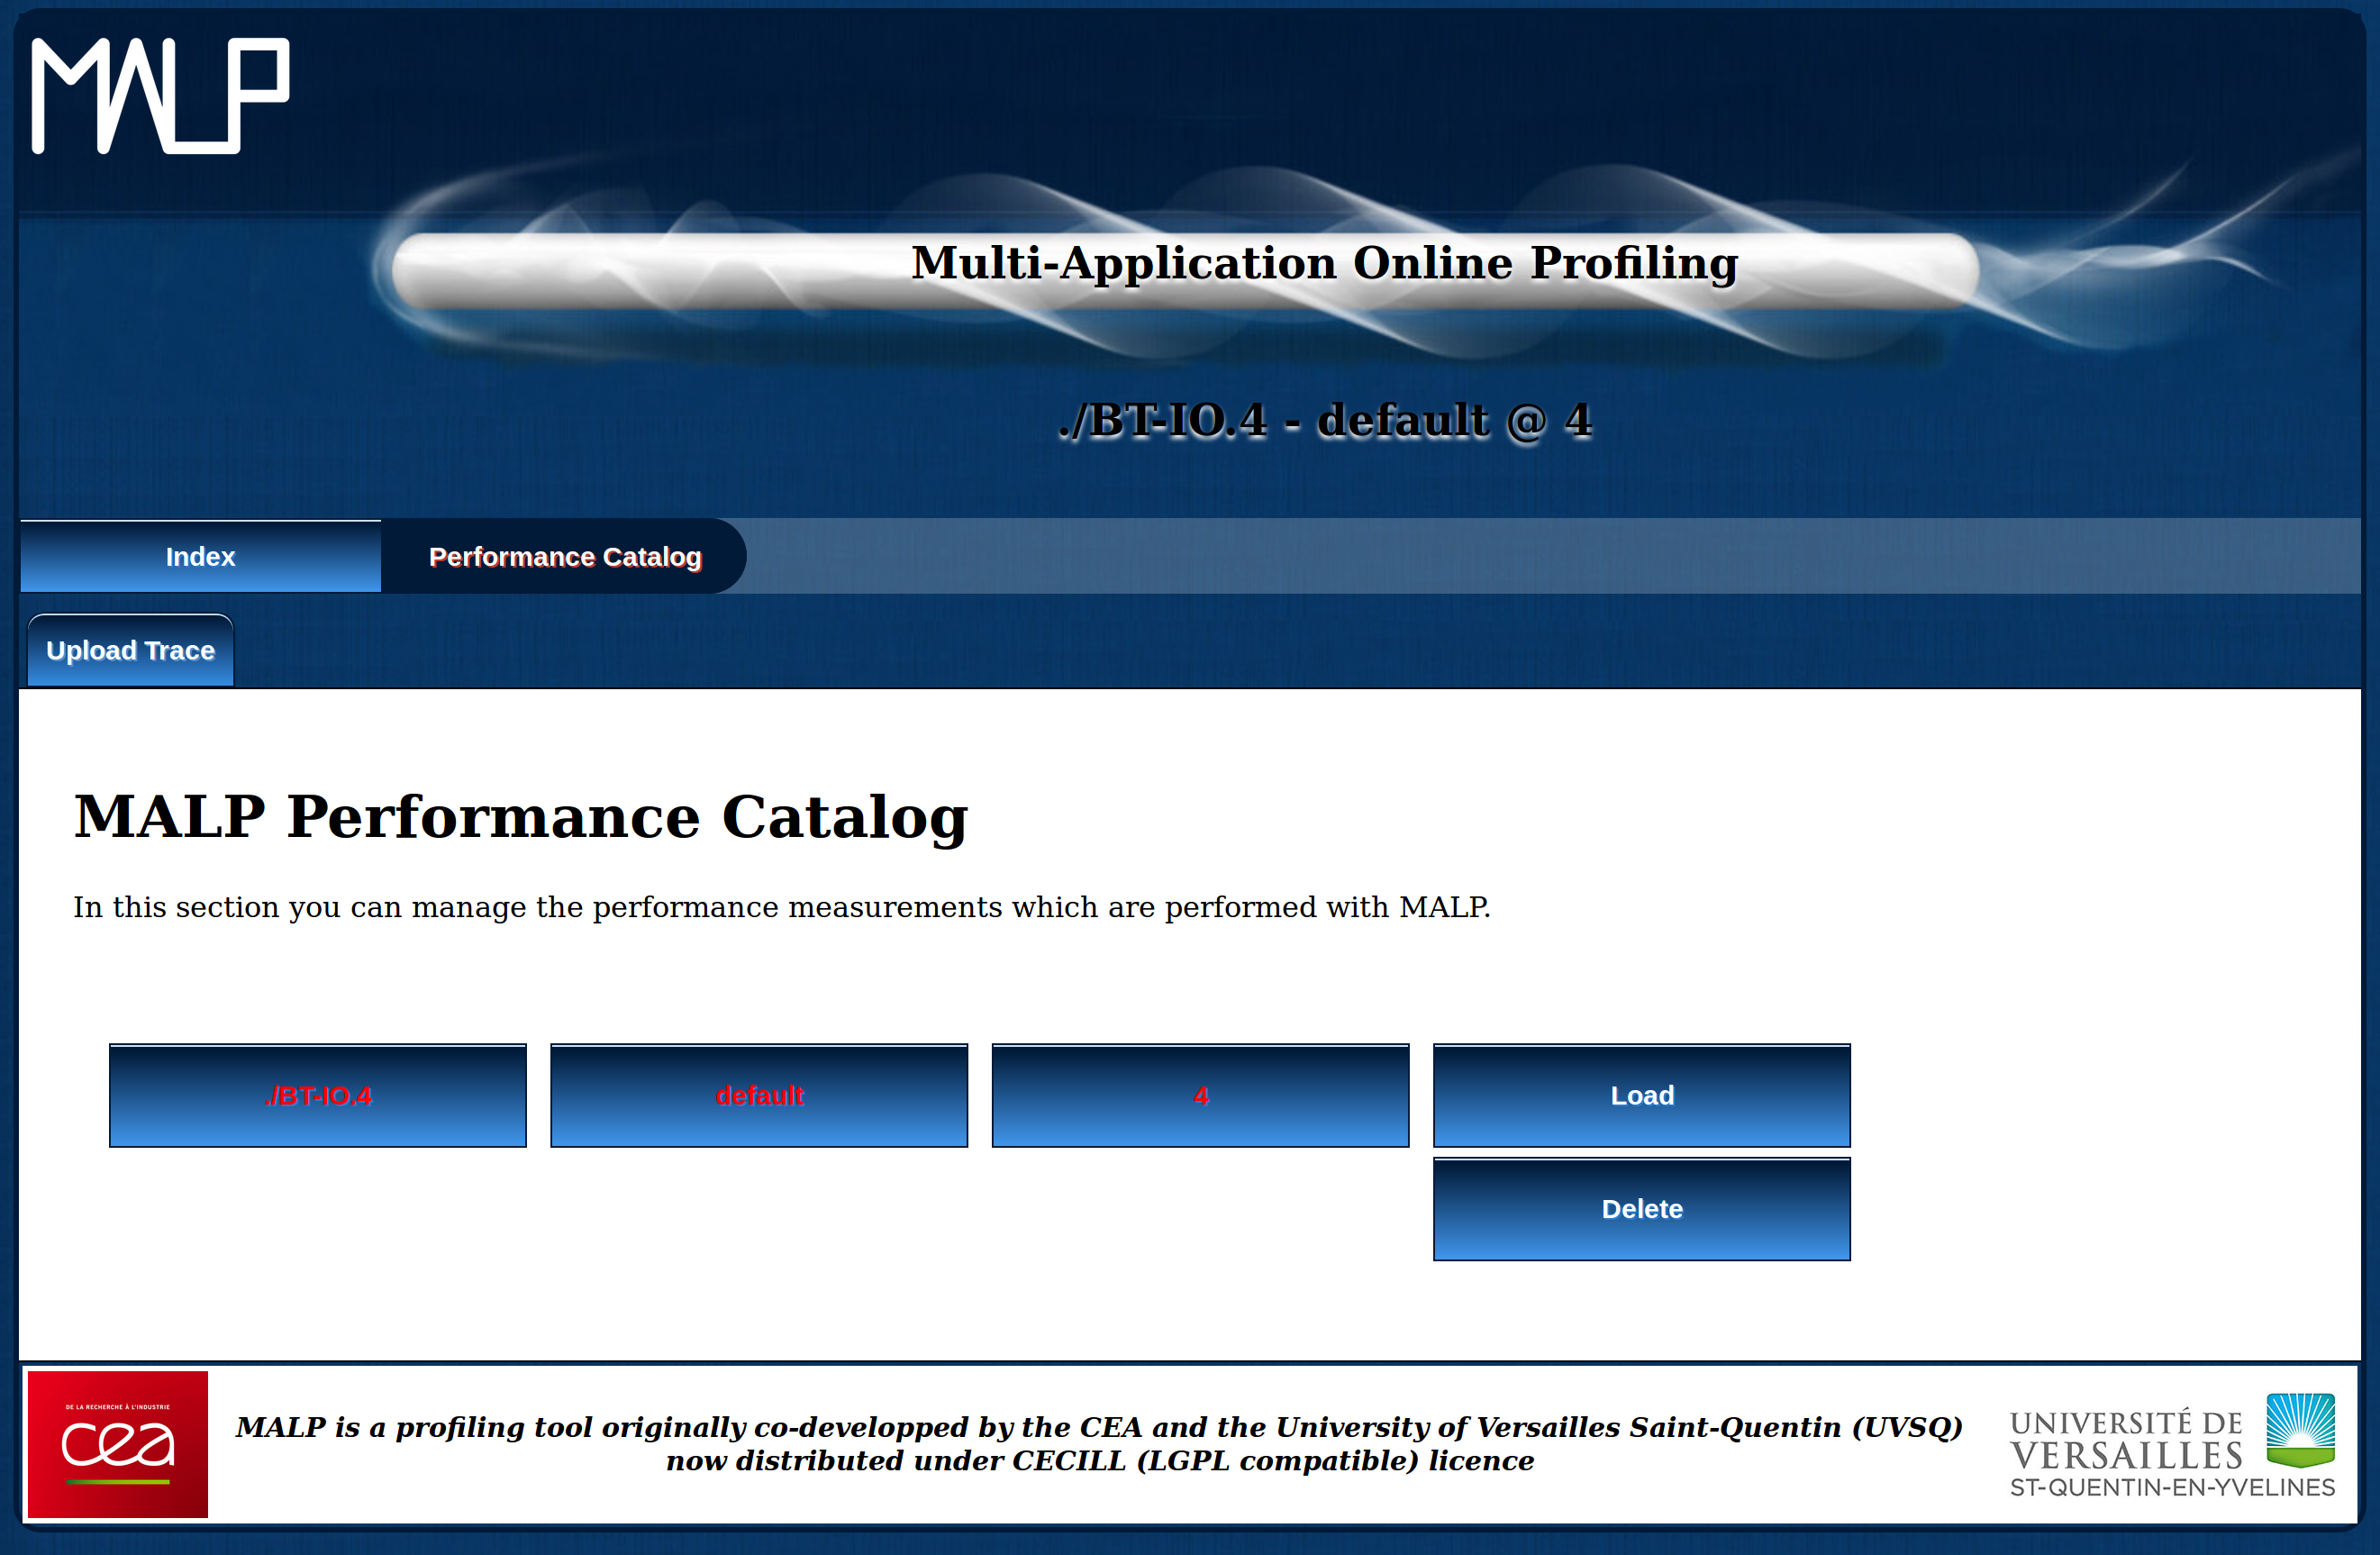
After these steps, you can explore your performance trace using the various buttons at the top of the page. Note that if you ever want to load another trace, this has to be done in the Performance Catalog, doing so will update all the other modules. Eventually, note that the file which is currently loaded is displayed at the top of the page for convenience.